Chapter 33 Simulation
We use simulation to generate a null distribution for a test statistic when we are concerned that the assumptions of the parametric test are not met.
If we use single cell mRNA fluorescent in situ hybridization (FISH) we can count the number of mRNAs for a particular gene per cell. Let’s assume that the number of molecules is a uniform distribiution that ranges from 10-20 molecules per cell.
To simulate this, generate a population of 1100 cells that have 10 or 11 or 12…or 20 mRNAs per cell
mRNA.count <- c(rep(10,100),rep(11,100),rep(12,100),rep(13,100),rep(14,100),
                rep(15,100),rep(16,100),rep(17,100),rep(18,100),rep(19,100),
                rep(20,100))

#clearly this is not a normal distribution
hist(mRNA.count, xlim=c(9,21), br=50)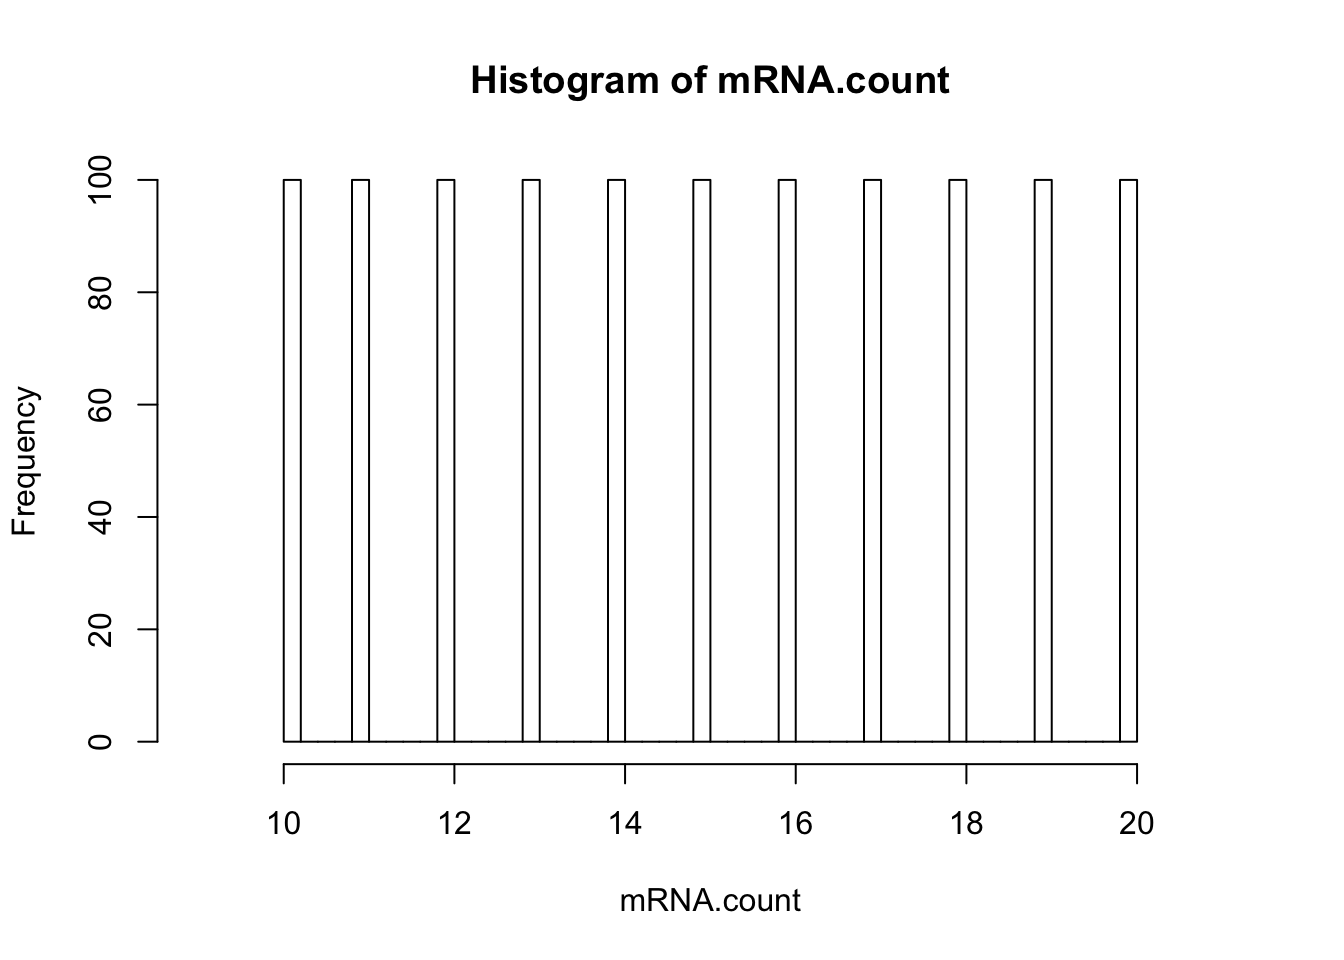
#we can simulate using a t test when the null hypotheis is true by drawing two samples of 5 cells from the same population
t.test(sample(mRNA.count,5), sample(mRNA.count,5))
##
## Welch Two Sample t-test
##
## data: sample(mRNA.count, 5) and sample(mRNA.count, 5)
## t = -1.427, df = 7.8043, p-value = 0.1924
## alternative hypothesis: true difference in means is not equal to 0
## 95 percent confidence interval:
## -7.869343 1.869343
## sample estimates:
## mean of x mean of y
## 15.4 18.4#now let's simulate what this would be like if we did it 10,000 times
sim.t.test <- replicate(10000, t.test(sample(mRNA.count,5), sample(mRNA.count,5))$statistic)
#look at the distribution of t statistics
hist(sim.t.test, br=50)
#add lines in red that demark the 5% critical values
abline(v=quantile(sim.t.test,probs=c(0.025,0.975)), col="red")
#compare to the theoretical t distributon for (n-2) 8 degrees of freedom
abline(v=qt(c(0.025,0.975),df=8), col="blue")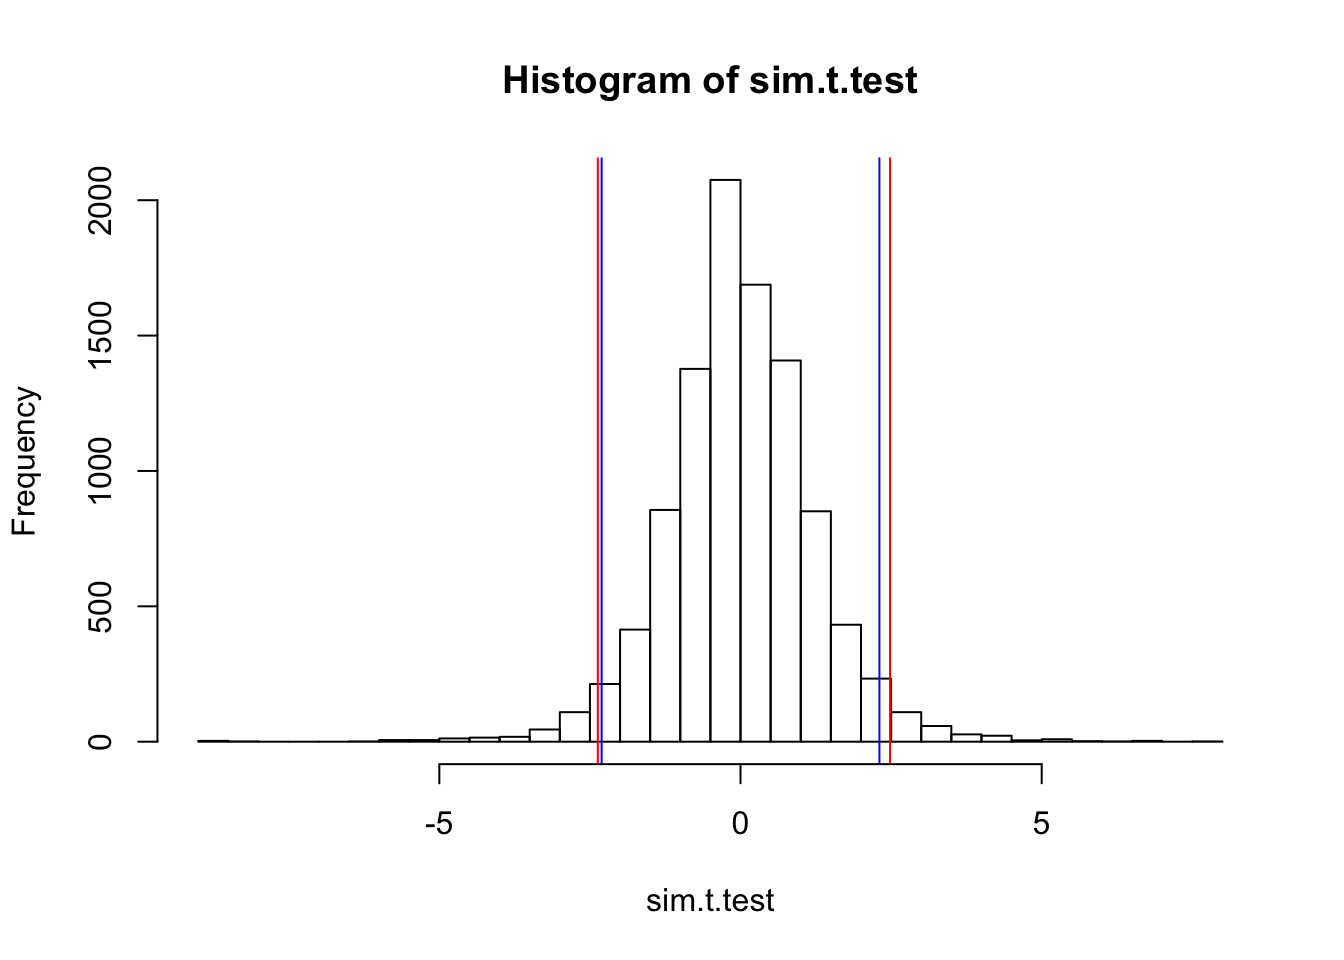
Based on this analysis I would be comfortable using a t-test for these data despite the fact they come from a uniform distribution. We can use either the critical values from the simulation or from the theoretical t disttribution.