Chapter 17 LOD scores
A LOD score (logarithm of odds) compares the likelihood of the data given two different models.
17.1 Phase known
#set a range of recombination probabilities (randing from 0 to 0.5) for which we want to calculate the likelihood
theta <- seq(0, 0.5, by=0.01)

#calculate the LOD score for a single recombinant and 5 nonrecombinant
z <- log10(theta^1*(1-theta)^5/(0.5)^6)

#plot LOD scores as a function of theta.  Don't include the lod score for theta = 0, which is infinity
plot(theta[-1],z[-1], type="l", lwd=3, xlab="theta", ylab="Z (LOD Score)", col=2, ylim=c(-0.2,0.65))

#get the value of theta that corresponds to the maximal likelihood value by indexing
y <- theta[z==max(z)]

#add line at the maximal likelihood value
abline(v=y, lty=2, lwd=3)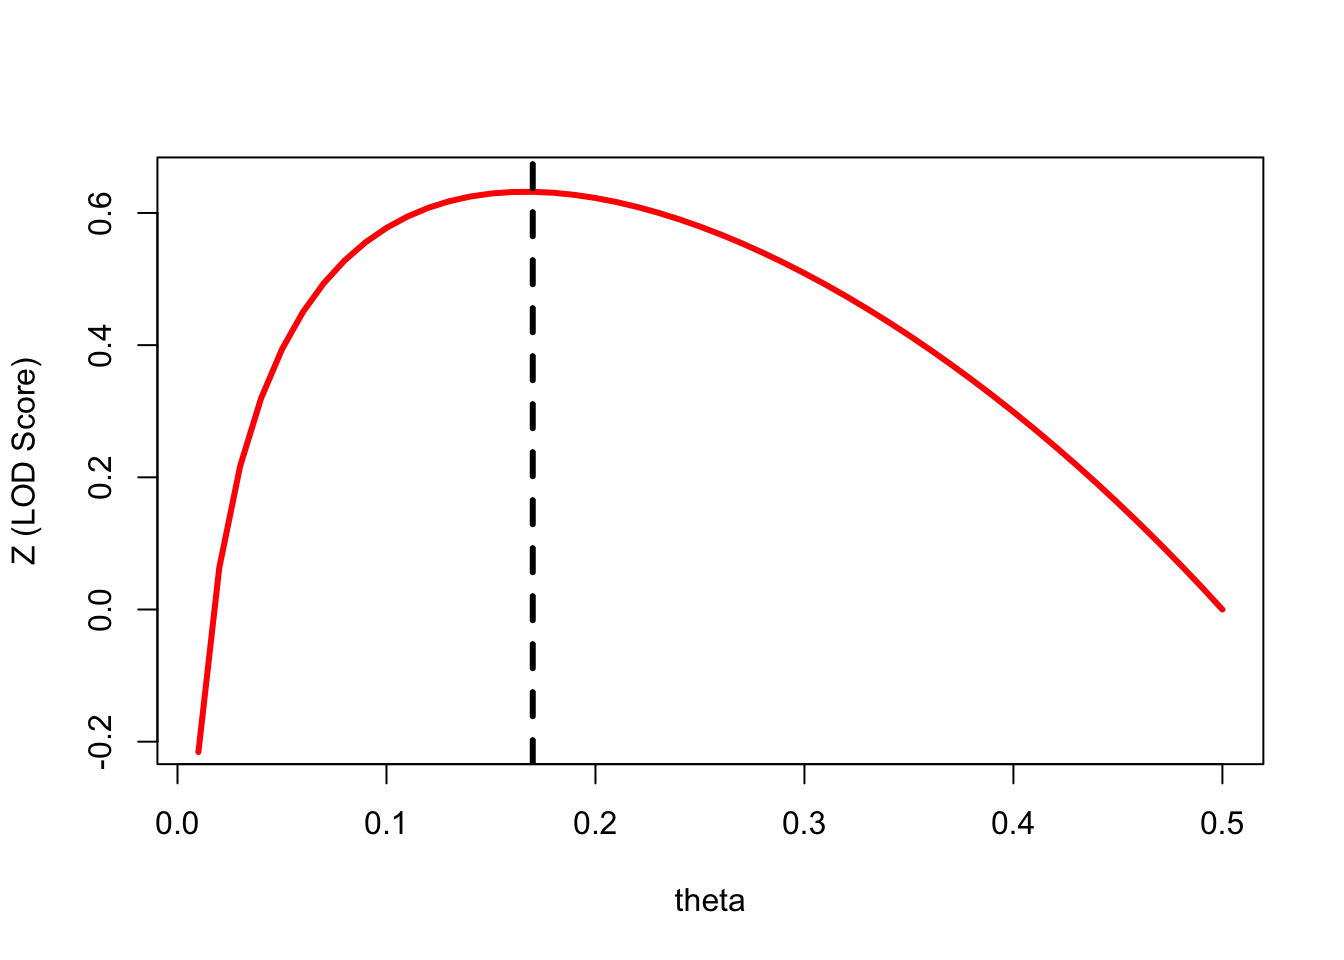
## [1] 0.632019417.2 Phase unknown
#set a range of recombination probabilities (randing from 0 to 0.5) for which we want to calculate the likelihood
theta <- seq(0, 0.5, by=0.01)

#calculate the LOD score for a single recombinant and 5 nonrecombinant
z.2 <- log10(0.5*(theta^1*(1-theta)^5/(0.5)^6) + 0.5*(theta^5*(1-theta)^1/(0.5)^6))

#plot LOD scores as a function of theta.  Don't include the lod score for theta = 0, which is infinity
plot(theta[-1],z.2[-1], type="l", lwd=3, xlab="theta", ylab="Z (LOD Score)", col=2, ylim=c(-0.2,0.65))

#get the value of theta that corresponds to the maximal likelihood value by indexing
y.1 <- theta[z.2==max(z.2)]

#add line at the maximal likelihood value
abline(v=y.1, lty=2, lwd=3)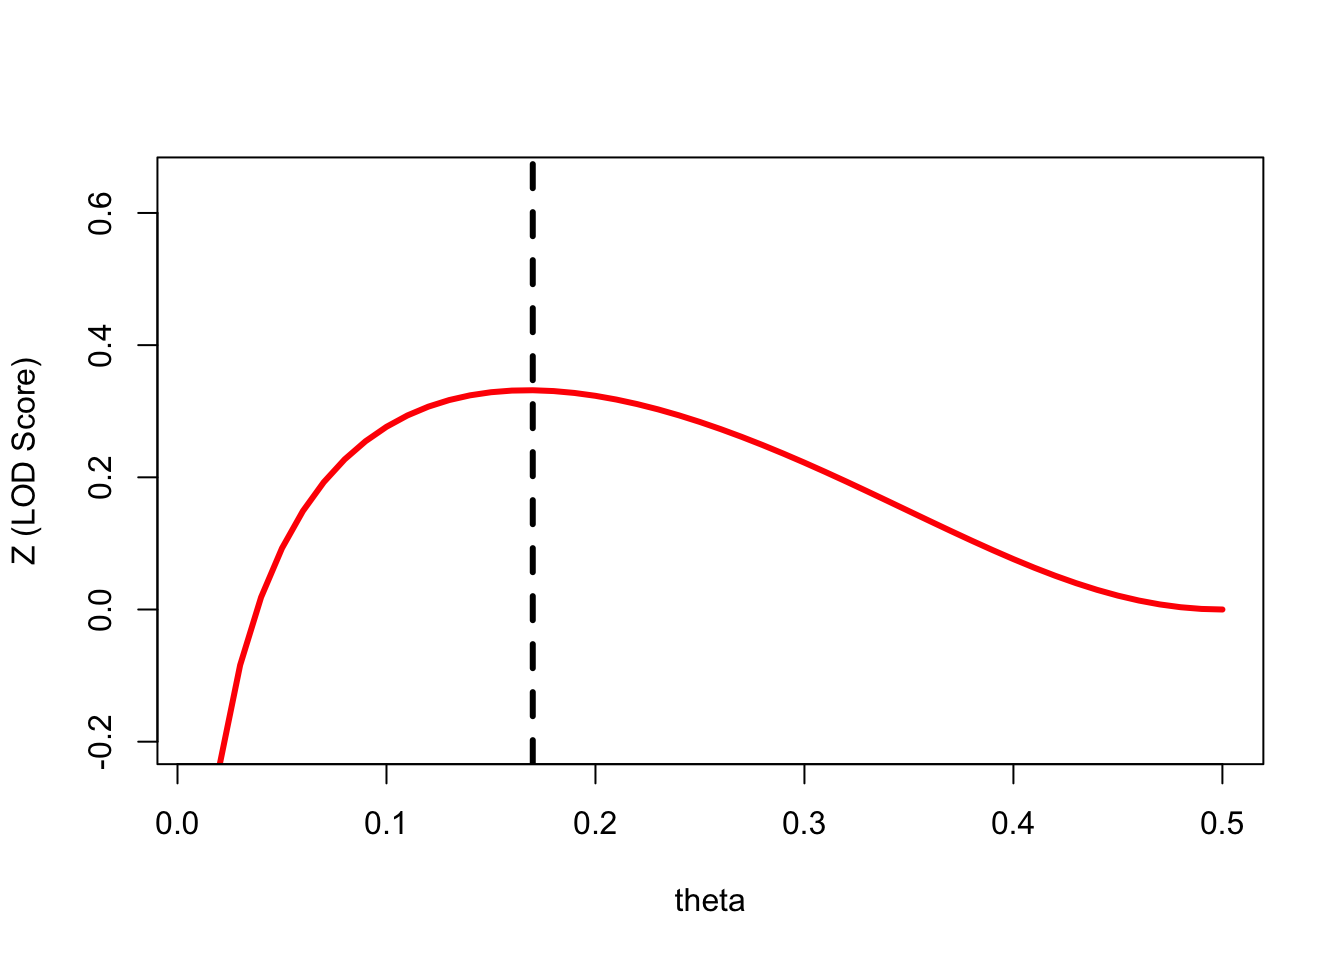
## [1] 0.331753