Chapter 28 ANOVA: analysis of variance
to perform the analysis of variance performed in class you need to load the lecture19.Rdata file
## The following object is masked _by_ .GlobalEnv:
##
##     bw
28.1 Performing ANOVA in R
## Call:
##    aov(formula = bw ~ genotype)
##
## Terms:
##                 genotype Residuals
## Sum of Squares  507989.9  475210.6
## Deg. of Freedom        2        12
##
## Residual standard error: 198.9997
## Estimated effects may be unbalanced## Df Sum Sq Mean Sq F value Pr(>F)
## genotype 2 507990 253995 6.414 0.0127 *
## Residuals 12 475211 39601
## ---
## Signif. codes: 0 '***' 0.001 '**' 0.01 '*' 0.05 '.' 0.1 ' ' 1#plot bw data as a simple dot plot
plot(c(bw[1:5], bw[11:15], bw[6:10]), pch=1, lwd=3, col=c(2,2,2,2,2,4,4,4,4,4,1,1,1,1,1), ylim=c(2800,4100), xlab="", ylab="Birthweight (g)", xaxt='n', ann=FALSE)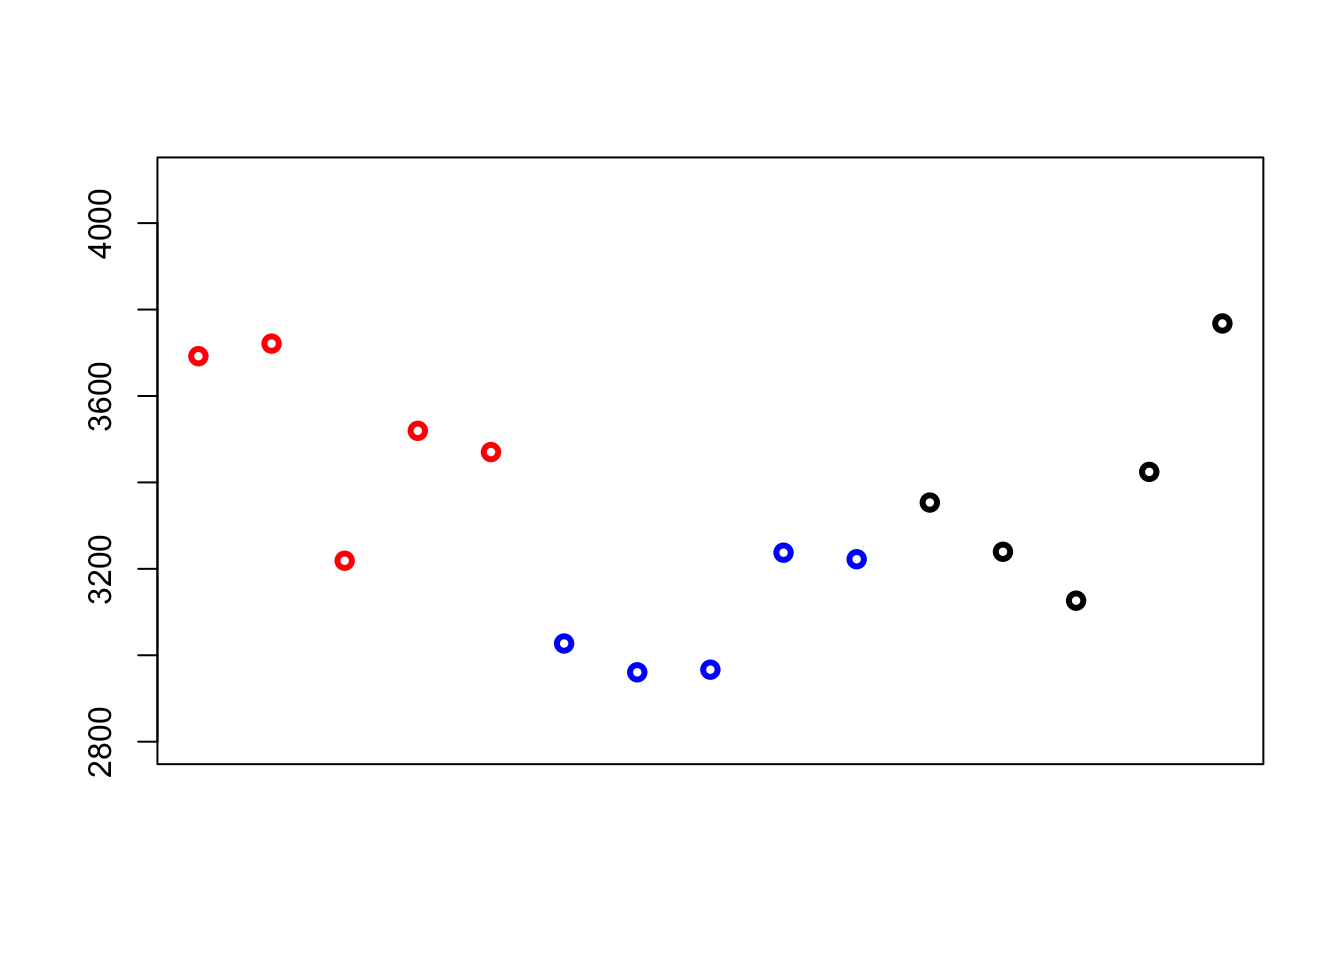
par(mfrow = c(1,3))
#plot bw data as a simple dot plot
plot(c(bw[1:5], bw[11:15], bw[6:10]), pch=20, lwd=1, col=c(2,2,2,2,2,4,4,4,4,4,1,1,1,1,1), ylim=c(2800,4100), xlab="", ylab="Birthweight (g)", xaxt='n', ann=FALSE, cex.axis=1.5, cex=2)
plot(c(bw[1:5], bw[11:15], bw[6:10]), pch=20, lwd=1, col=c(2,2,2,2,2,4,4,4,4,4,1,1,1,1,1), ylim=c(2800,4100), xlab="", ylab="Birthweight (g)", xaxt='n', ann=FALSE, cex.axis=1.5, cex=2)
plot(c(bw[1:5], bw[11:15], bw[6:10]), pch=20, lwd=1, col=c(2,2,2,2,2,4,4,4,4,4,1,1,1,1,1), ylim=c(2800,4100), xlab="", ylab="Birthweight (g)", xaxt='n', ann=FALSE, cex.axis=1.5, cex=2)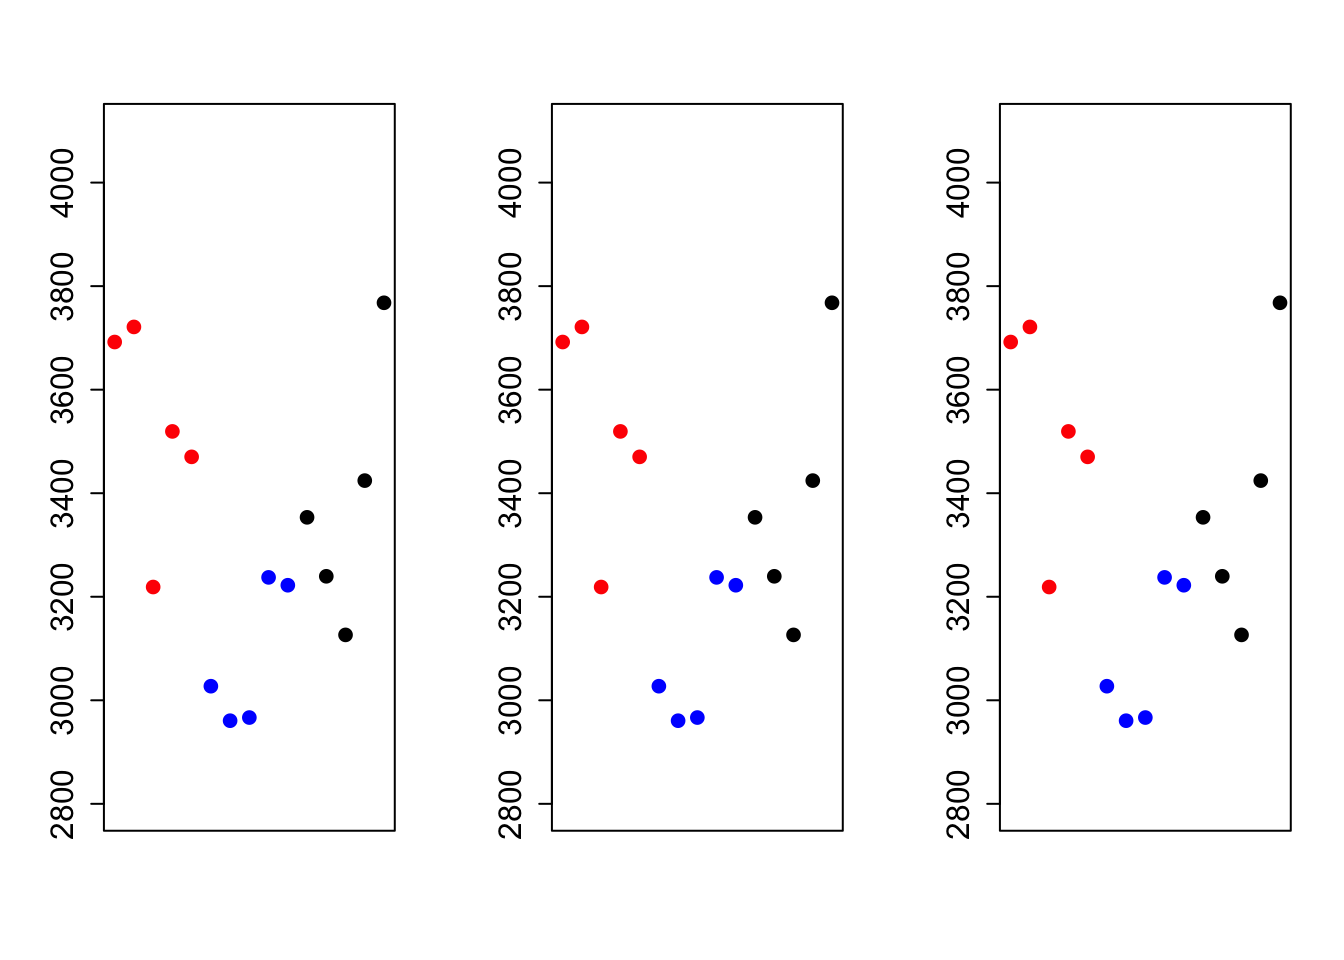
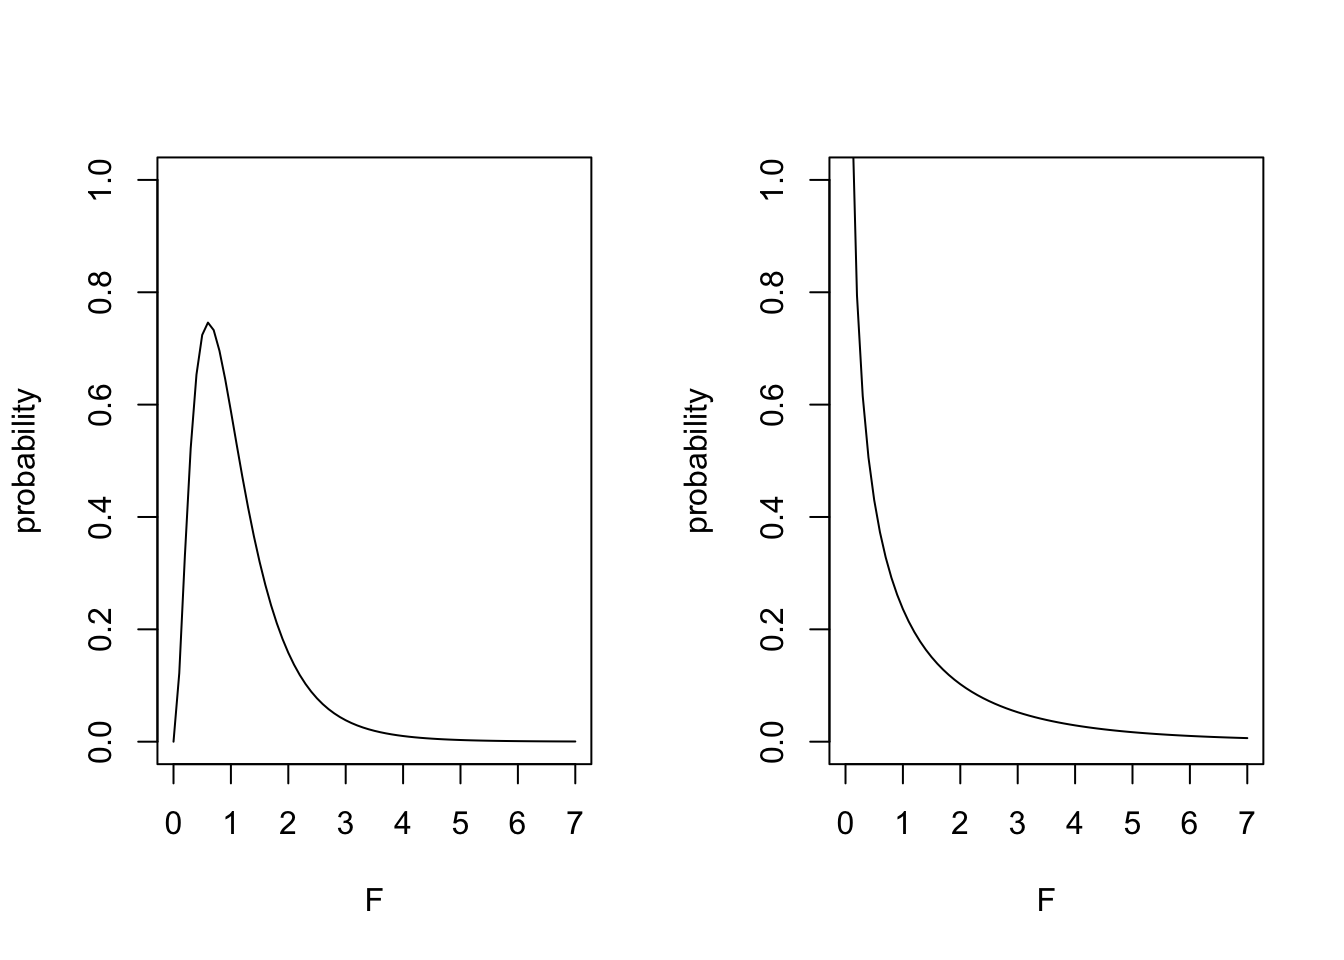
28.2 The F distribution
par(mfrow=c(1,2))

#Plot an F distribution
nd <- seq(0,7,0.1)
y <- df(nd,2,20)
plot(nd,y,type="l", xlab="F", ylab="probability", ylim=c(0,1))

y <- df(nd,4,20)
plot(nd,y,type="l", xlab="F", ylab="probability", ylim=c(0,1))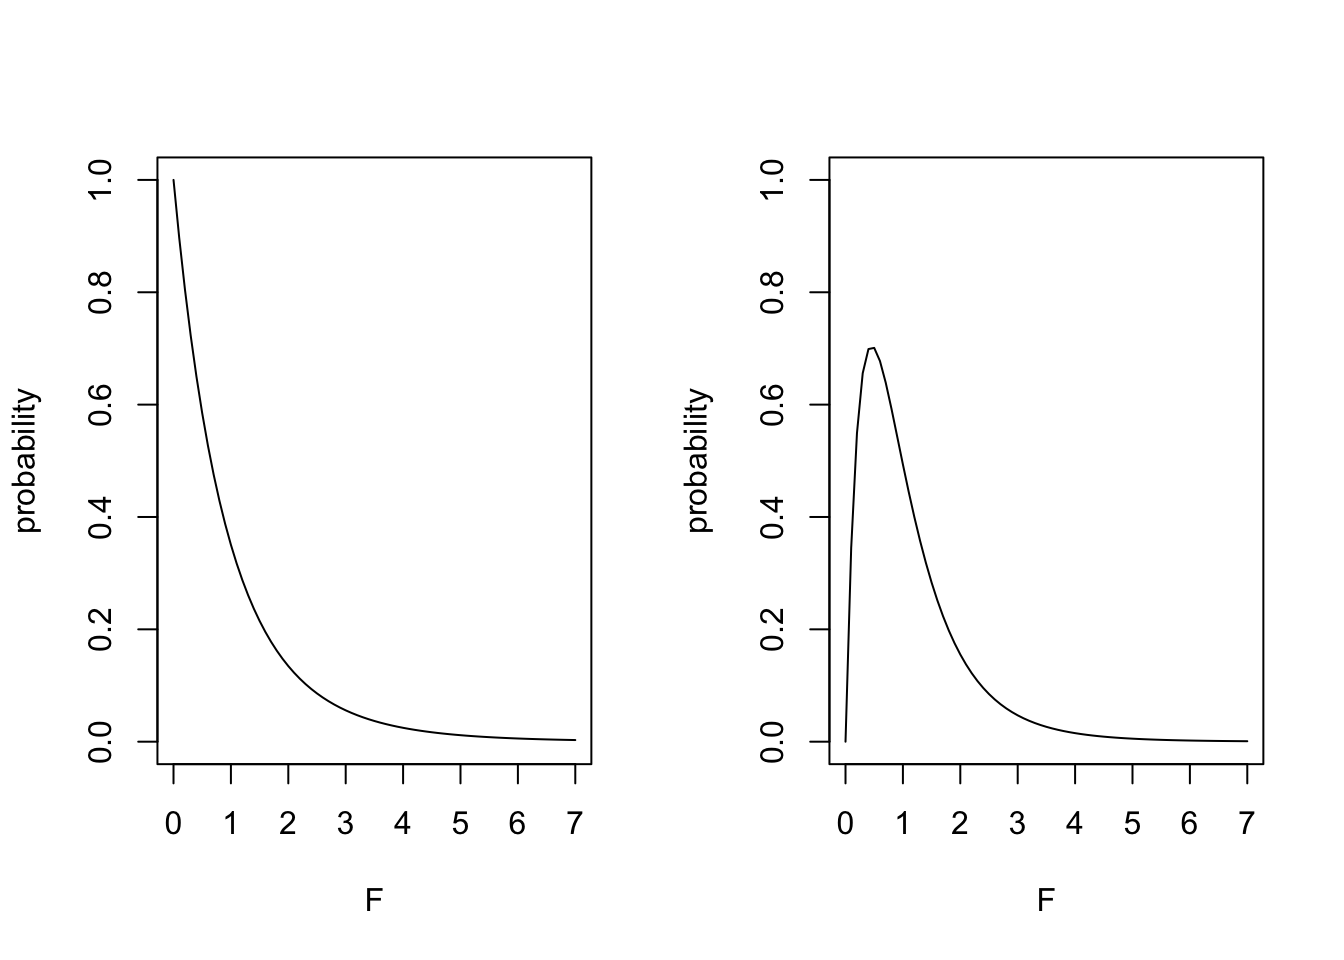
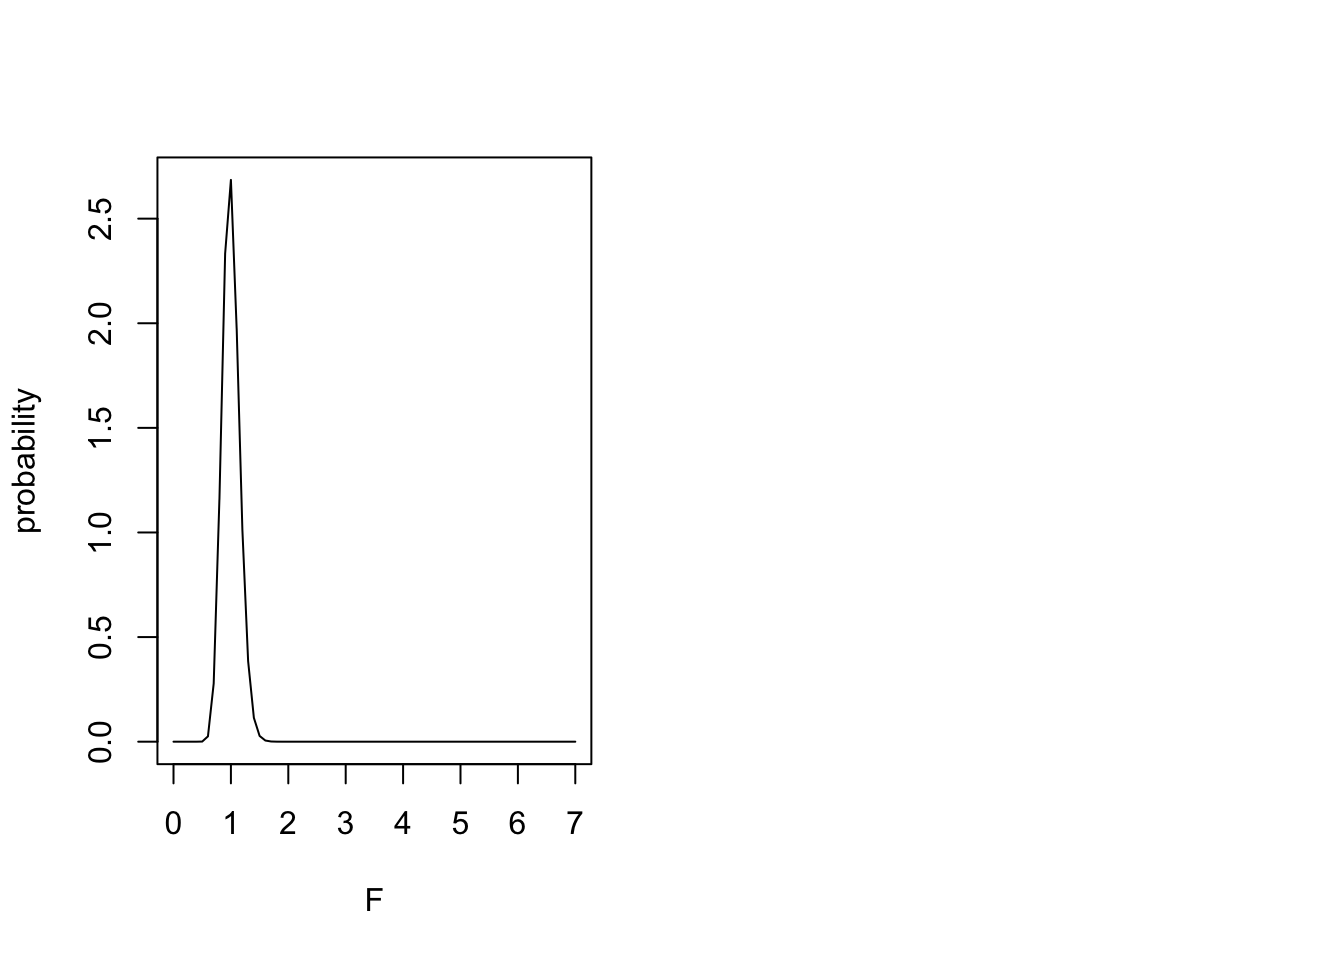
y <- df(nd,6,20)
plot(nd,y,type="l", xlab="F", ylab="probability", ylim=c(0,1))

y <- df(nd,1,20)
plot(nd,y,type="l", xlab="F", ylab="probability", ylim=c(0,1))