Chapter 29 Covariance and correlation
29.1 Covariance
#generate matrix of twin IQs then turn it into a dataframe
twins <- matrix(data = c(100,125,97,92,86,110,118,90,104,89), ncol=2, dimnames= list(c("A","B","C","D","E"),c("twin1","twin2")))
twins <- data.frame(twins)
attach(twins)

#calculate the variance within "twin1" and "twin2" and test whether they are additive
var(twin1)
## [1] 223.5## [1] 159.2## [1] 382.7## [1] 171.4333## [1] 150.5## [1] 0.8778923#plot covariance between twin 1 and twin 2
plot(twin1,twin2, xlim=c(75,130), ylim=c(75,130), lwd=3)
abline(v=mean(twin1), lty=2, lwd=2)
abline(h=mean(twin2), lty=2, lwd=2)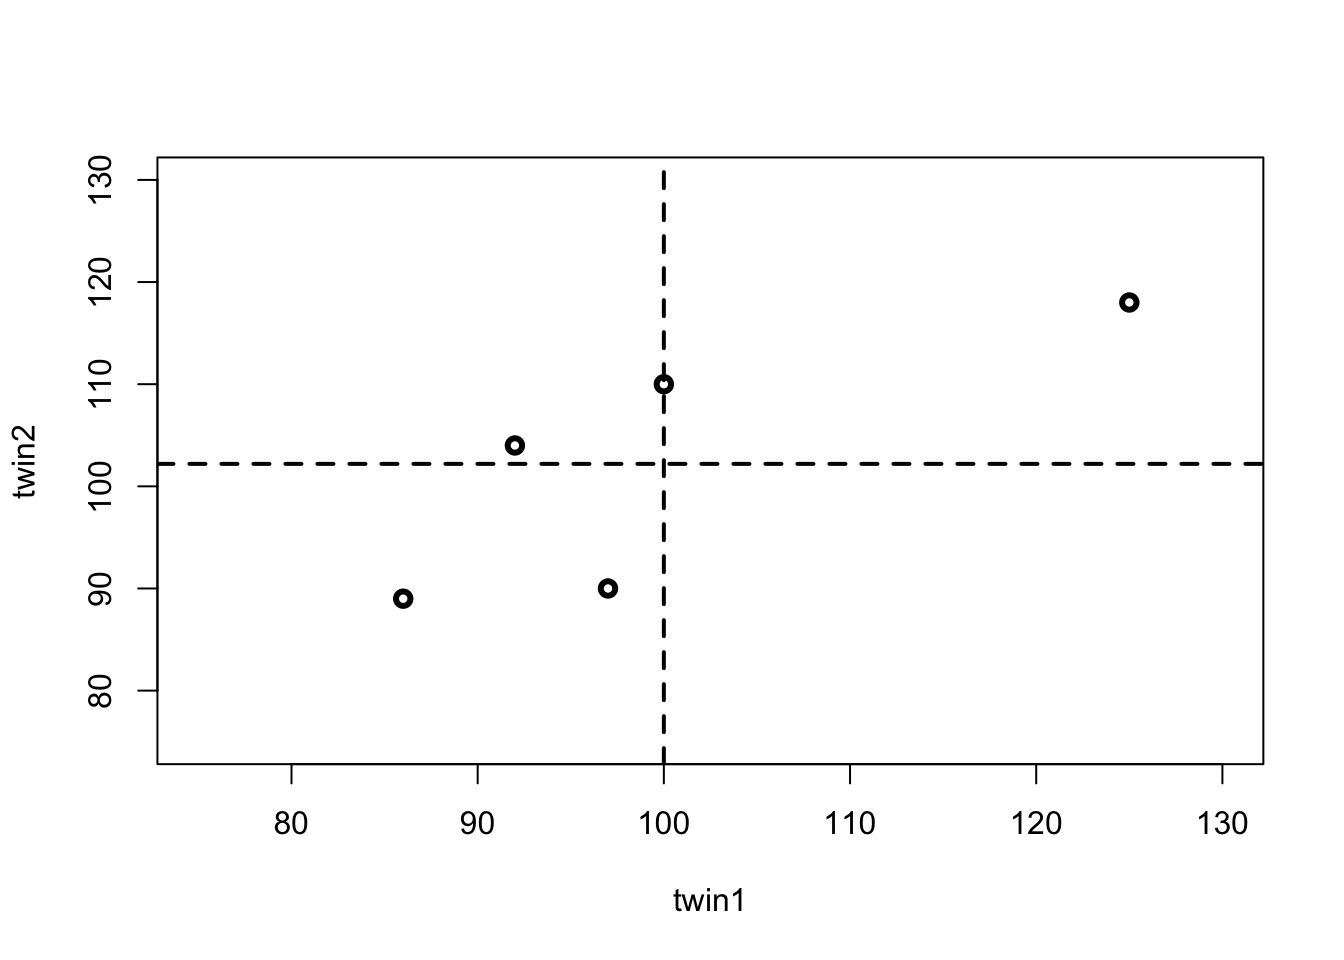
29.2 Correlation
## [1] 0.7978591##
## Pearson's product-moment correlation
##
## data: twin1 and twin2
## t = 2.2924, df = 3, p-value = 0.1057
## alternative hypothesis: true correlation is not equal to 0
## 95 percent confidence interval:
## -0.285087 0.986033
## sample estimates:
## cor
## 0.797859129.3 Generaing simulated datasets
##
## Attaching package: 'MASS'
## The following object is masked from 'bw.data':
##
## genotype#the function mvrnorm generates a matrix in which you need to specify the mean, variance and covariance
xy <- mvrnorm(1000,mu=c(50,60),matrix(c(4.3,3.7,3.7,7.9),2))
var(xy)## [,1] [,2]
## [1,] 4.288743 3.748418
## [2,] 3.748418 7.687667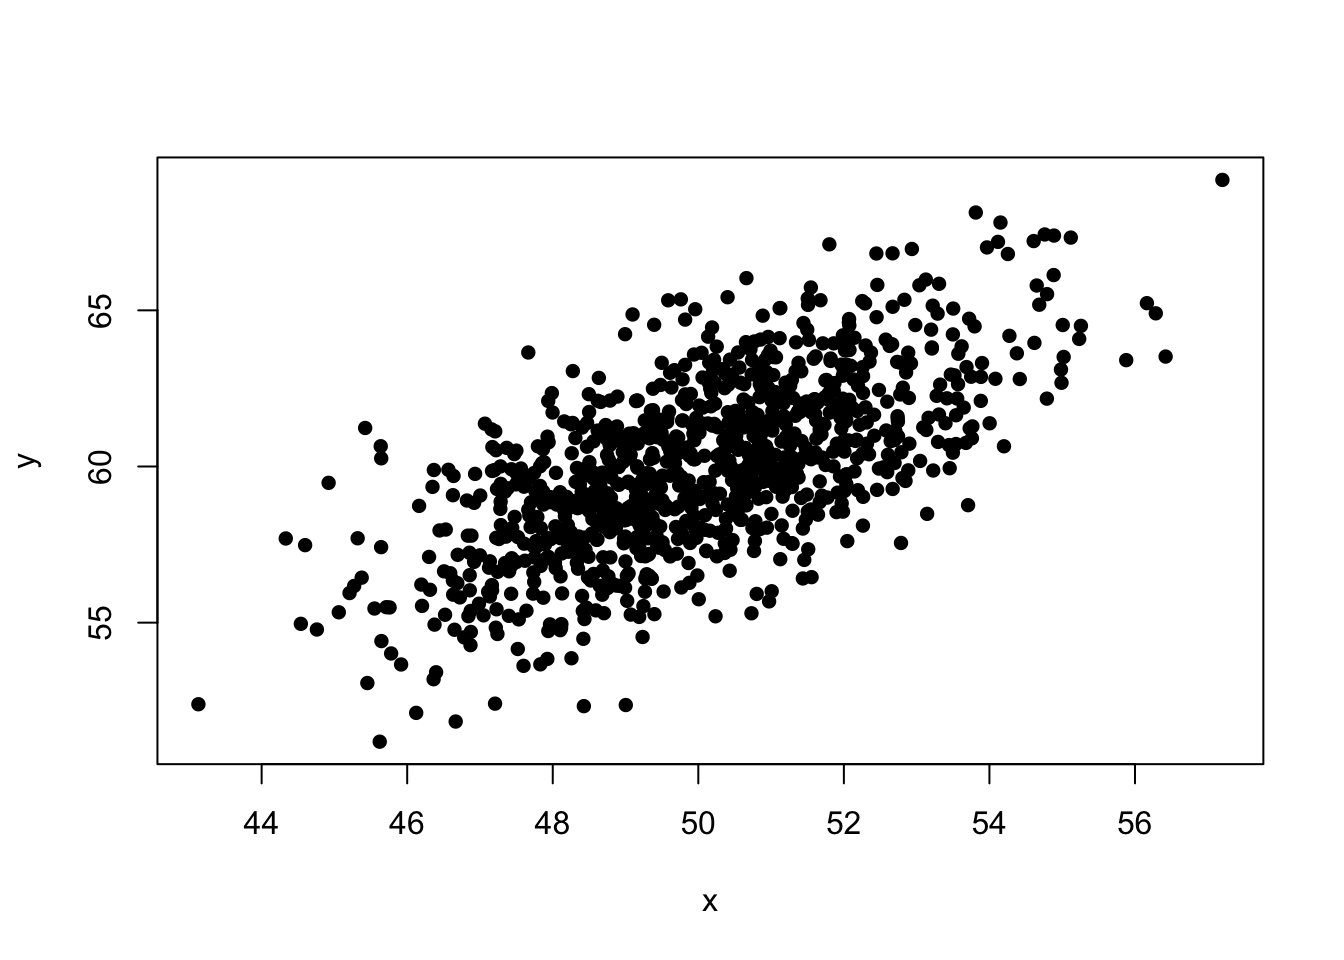
## [1] 4.288743## [1] 7.687667## [1] 3.748418#the correlation coefficient is the covariance divided by the geometric mean of the individual variances
var(x,y)/sqrt(var(x)*var(y))## [1] 0.6528084## [1] 0.6528084##
## Pearson's product-moment correlation
##
## data: x and y
## t = 27.224, df = 998, p-value < 2.2e-16
## alternative hypothesis: true correlation is not equal to 0
## 95 percent confidence interval:
## 0.6157338 0.6869989
## sample estimates:
## cor
## 0.6528084###########################################
#generate a martix of uncorrelated values##
###########################################
wz <- mvrnorm(1000,mu=c(50,60),matrix(c(4.3,0,0,7.9),2))
var(wz)## [,1] [,2]
## [1,] 4.1876497 -0.2733429
## [2,] -0.2733429 7.5800078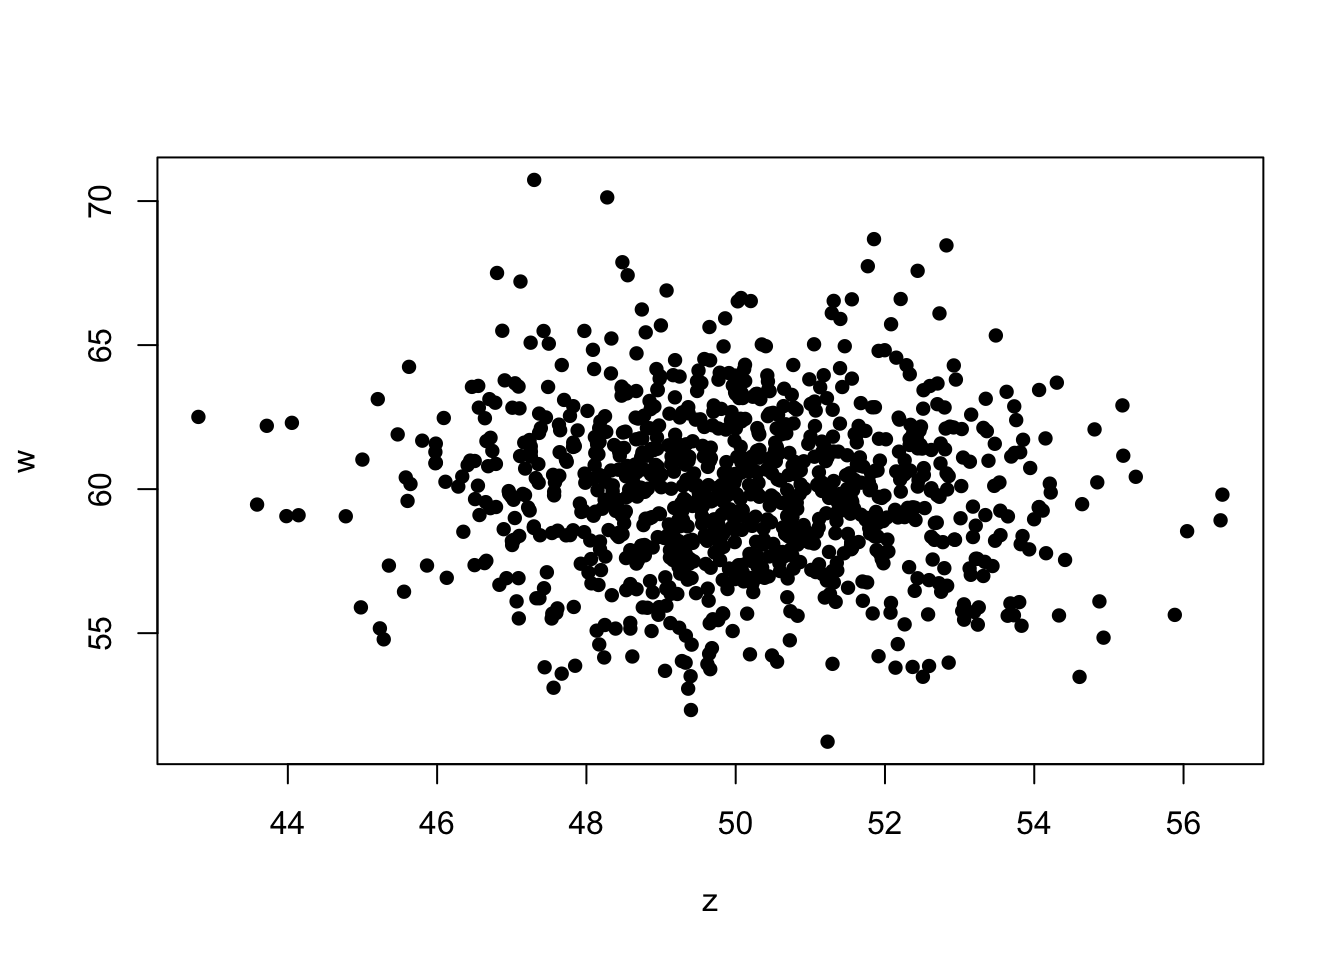
## [1] 4.18765## [1] 7.580008## [1] -0.2733429#the correlation coefficient is the covariance divided by the geometric mean of the individual variances
var(w,z)/sqrt(var(w)*var(z))## [1] -0.04851631## [1] -0.04851631##
## Pearson's product-moment correlation
##
## data: w and z
## t = -1.5345, df = 998, p-value = 0.1252
## alternative hypothesis: true correlation is not equal to 0
## 95 percent confidence interval:
## -0.11017801 0.01351743
## sample estimates:
## cor
## -0.04851631