Chapter 31 Nonparametric methods
31.1 The sign test.
The non-parametric alternative to the one sample or paired t-test
before <- c(5,100,2000,20,1000)
after <- c(8,98,2200,16,900)

#a paired t-test returns the following result
t.test(before,after, paired=T, equal.var=T)
##
## Paired t-test
##
## data: before and after
## t = -0.3954, df = 4, p-value = 0.7127
## alternative hypothesis: true difference in means is not equal to 0
## 95 percent confidence interval:
## -155.6259 116.8259
## sample estimates:
## mean of the differences
## -19.4#We can implement a sign test ourselves by:
#1. calculate the difference
diff <- after-before
#2 count how many are +ve (greater than zero)
sum(diff>0) #there are two + values of 5 total## [1] 2#Compute the probability of getting two or less values greater than zero from 5 "trials" (one side) or two or less values less than zero from 5 "trials" if the null hypothesis is true (i.e. eqal probability of getting + or - ; p=0.5).
binom.test(2,5,0.5, alternative="two.sided") #p-value=1 ##
## Exact binomial test
##
## data: 2 and 5
## number of successes = 2, number of trials = 5, p-value = 1
## alternative hypothesis: true probability of success is not equal to 0.5
## 95 percent confidence interval:
## 0.05274495 0.85336720
## sample estimates:
## probability of success
## 0.431.2 Performing sign tests in R
Alternatively, the wilcox.test() function performs a paired sample test of the Wilcoxon signed rank test of the null that the distribution of x - y (in the paired two sample case) is symmetric about mu.
##
##  Wilcoxon signed rank test
##
## data:  before and after
## V = 8, p-value = 1
## alternative hypothesis: true location shift is not equal to 0
31.3 A more interesting example.
Generating two random samples or 300 values fron uniform distributions that differ slightly
set.seed(1)
before1 <- runif(300, min=-0.5,max=0.5)
set.seed(2)
after1 <- runif(300,min=-0.45,max=0.55)

diff1 <- after1-before1
sum(diff1<0) #number of values out of 300 that are below zero (-ve)
## [1] 127##
## Exact binomial test
##
## data: sum(diff1 < 0) and 300
## number of successes = 127, number of trials = 300, p-value =
## 0.009261
## alternative hypothesis: true probability of success is not equal to 0.5
## 95 percent confidence interval:
## 0.3667592 0.4814368
## sample estimates:
## probability of success
## 0.4233333##
## Wilcoxon signed rank test with continuity correction
##
## data: before1 and after1
## V = 19195, p-value = 0.02462
## alternative hypothesis: true location shift is not equal to 0##
## Paired t-test
##
## data: before1 and after1
## t = -2.2709, df = 299, p-value = 0.02387
## alternative hypothesis: true difference in means is not equal to 0
## 95 percent confidence interval:
## -0.102153061 -0.007300815
## sample estimates:
## mean of the differences
## -0.0547269431.4 The Mann-Whitney test.
An alternative to two sample t-test
##
##  Wilcoxon rank sum test
##
## data:  sample2 and sample1
## W = 11, p-value = 0.9048
## alternative hypothesis: true location shift is not equal to 0
A more interesting example. generating two random samples or 300 values fron uniform distributions that differ slightly
set.seed(3)
sample3 <- runif(300, min=-5,max=5)
set.seed(4)
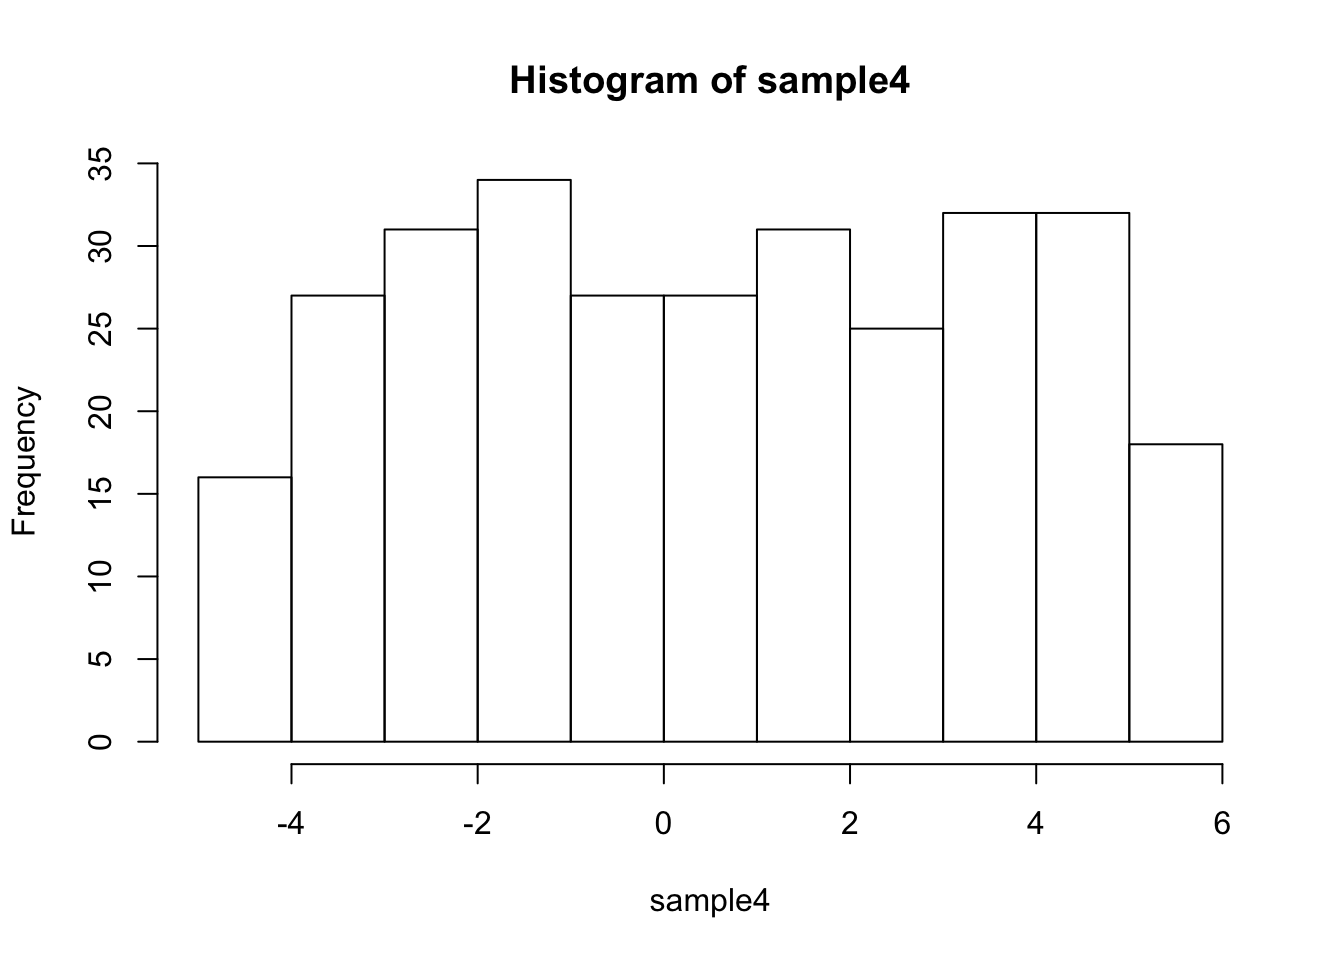
sample4 <- runif(300,min=-4.5,max=5.5)
#the samples are not very normal
hist(sample3)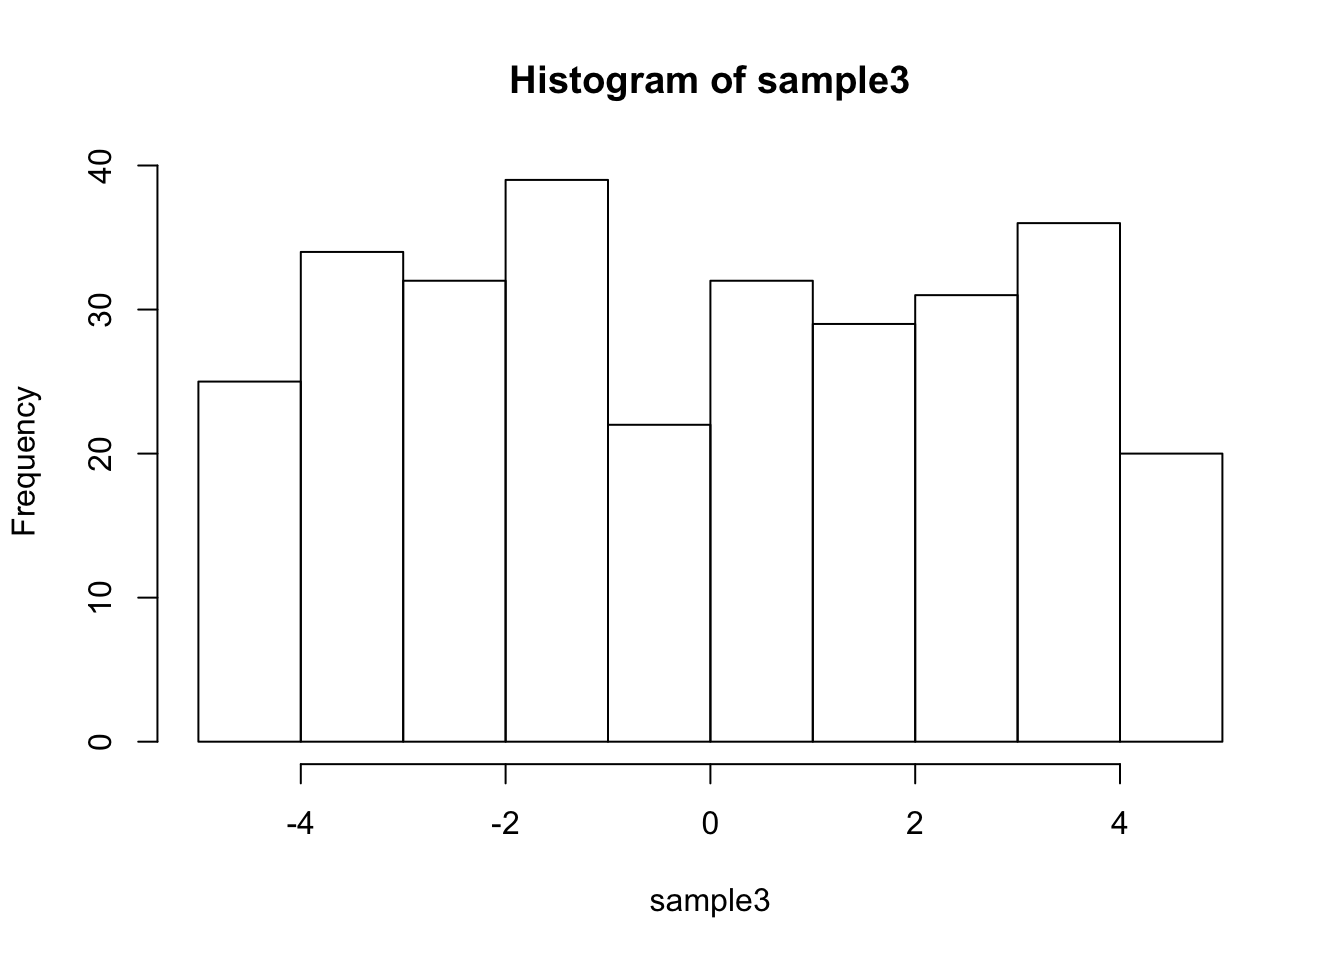
## [1] -0.109044## [1] 0.544414##
## Wilcoxon rank sum test with continuity correction
##
## data: sample3 and sample4
## W = 39269, p-value = 0.006952
## alternative hypothesis: true location shift is not equal to 0##
## Welch Two Sample t-test
##
## data: sample3 and sample4
## t = -2.7738, df = 595.89, p-value = 0.005714
## alternative hypothesis: true difference in means is not equal to 0
## 95 percent confidence interval:
## -1.116131 -0.190785
## sample estimates:
## mean of x mean of y
## -0.109044 0.54441431.5 Spearman (rank) correlation
tumor.grade <- c(1,2,2,3,3,4,5,5)
gene.expression <- c(20,20,30,40,50,40,40,50)

cor.test(tumor.grade,gene.expression) #pearson linear correlation by default
##
## Pearson's product-moment correlation
##
## data: tumor.grade and gene.expression
## t = 2.9897, df = 6, p-value = 0.02433
## alternative hypothesis: true correlation is not equal to 0
## 95 percent confidence interval:
## 0.1513500 0.9567115
## sample estimates:
## cor
## 0.7735248## Warning in cor.test.default(tumor.grade, gene.expression, method =
## "spearman"): Cannot compute exact p-value with ties##
## Spearman's rank correlation rho
##
## data: tumor.grade and gene.expression
## S = 19.007, p-value = 0.02427
## alternative hypothesis: true rho is not equal to 0
## sample estimates:
## rho
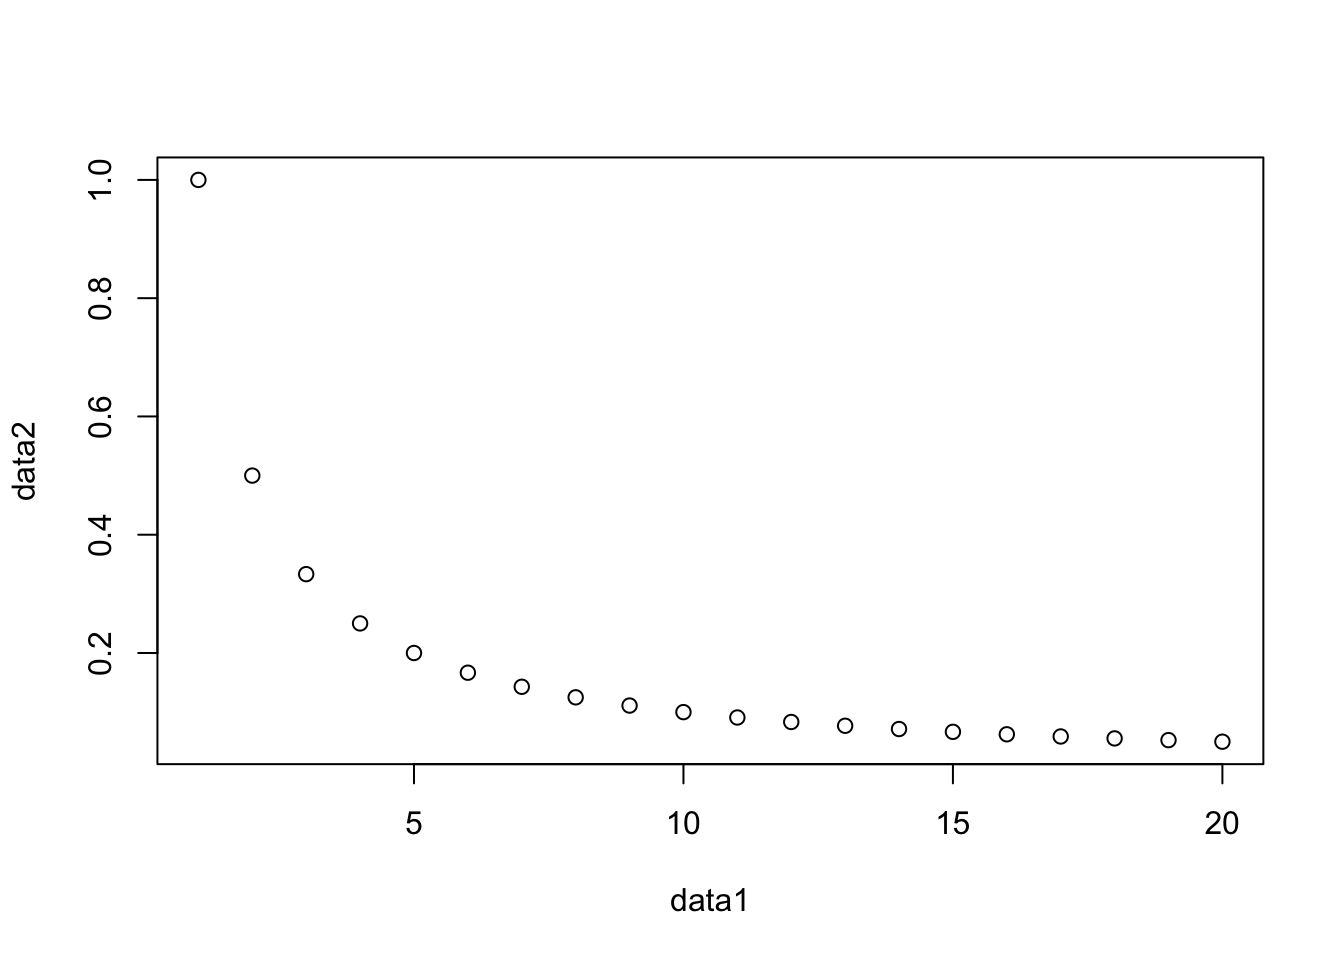
## 0.773722631.5.1 Comparing spearman and pearson correlation
Will often look similar, but for the example below they differ
##
##  Pearson's product-moment correlation
##
## data:  data1 and data2
## t = -4.2488, df = 18, p-value = 0.0004829
## alternative hypothesis: true correlation is not equal to 0
## 95 percent confidence interval:
##  -0.8758744 -0.3859614
## sample estimates:
##       cor
## -0.707623##
## Spearman's rank correlation rho
##
## data: data1 and data2
## S = 2660, p-value = 5.976e-06
## alternative hypothesis: true rho is not equal to 0
## sample estimates:
## rho
## -1